Detecting PsExec lateral movements: 4 artifacts to sniff out intruders
Four powerful artifacts to help you close in on attackers roaming around your digital environment and attempting to move laterally.

Table of Contents
What is PsExec?
PsExec is a tool that allows for remote process execution. System administrators often use this tool for remote script execution, such as a setup script or data collection.
It’s free and it works, saving the hassle of trying to get a budget for more expensive tools that may not deliver on either of those qualities. It’s also been used for software deployment and managing endpoints remotely in large internal networks.
How attackers use PsExec to perform lateral movement
Attackers often use PsExec to perform lateral movement from one endpoint to another.
Let's look at this from the perspective of an attacker who is targeting the IT department's virtual local area network (VLAN) within a corporate environment.
The network is configured so that the different department servers and workstations—such as finance, HR, or in our case, IT—have dedicated virtual local area network (VLAN)/subnets.
While our attacker is after data within the IT department VLAN, they'll log into a server/workstation in the IT department by compromising a machine in the finance department.
This technique is called lateral movement. PsExec is a tool that helps perform it over SMB protocol.The usage and legitimacy of this tool are the same reason attackers love using it in target environments.
It may be a case that Antivirus(AV) and/or endpoint detection and response (EDR) are not configured to alert and log usage of these tools as they may be a legitimate use case in the environment.
Another thing is that PsExec is signed and distributed officially by Microsoft. Often, if PsExec is already in use in the environment, the attackers won't need to download and run the tool as it would already be in place. This helps them easily blend in with other legitimate noise or traffic.
It's important to note that there are different flavors of PsExec. For example:
-
SysInternals PsExec (The official one).
-
Impacket PsExec (Part of impacket suite).
-
Metasploit, CobaltStrike, or Empire PsExec (Any C2 framework basically).
While the main core is the same there are mini differences between them as they have been fine-tuned according to the use case. We will look into the official Sysinternals PsExec in this blog. However, the majority of detections are common among any flavor of the tool.
Boost your investigative skills with HTB

Tracer is a Sherlocks designed for practicing detection and analysis of artifacts and footprints left by the usage of PsExec for lateral movement.
Your goal: help Forela’s savvy SOC team uncover a security incident involving lateral movement between two employee workstations.
Tracer teaches individuals and teams how to:
-
Analyze USNJournal, Prerefetch,and other critical artifacts
-
Chain multiple artifacts together to build context
-
Build a timeline of events based on timestamps derived from different artifacts
Example attack path
Scenario:
-
We have 2 domain joined workstations (Windows 10 Pro), in which we will perform lateral movement from the 1st workstation to the 2nd. We will assume the attacker already got a foothold on the 1st workstation.
-
For log-based detections, we will be using Windows native event logs as well as sysmon logs using the Olaf Hartong’s config.
-
For other forensically sound artifacts, we will use KAPE to acquire the artifacts and analyze them on a forensics workstation. We will discuss the tool to use for parsing each artifact, as different artifacts require different tools for parsing. To analyze any CSV or JSON results files we’ll use a tool called Timeline Explorer by Eric Zimmerman.
Attack:
We have two workstations:
-
Forela-wkstn001
-
Forela-wkstn002
We will assume that the attacker has foothold access on the 001 workstation, and after performing some internal enumeration, they found credentials that would give them access to the 002 workstation.
Now before diving into technical aspects, it's important to mention that there are two ways we can execute remote commands on a remote computer via PsExec:
Option one: we run PsExec and authenticate over SMB. We can tell PsExec to give us an interactive session of CMD or Powershell. This would give us shell access and we can use it just like we use a normal CMD shell.
Option two: we provide our command as an argument that we want to be executed. PsExec will then return the output of that command and close its session.
While the second option generates more noise/events on the endpoint, this is the one that sysadmins use mostly. For example, if they want to run a routine cleanup script they can simply provide the command in the argument and PsExec will do that, instead of opening a shell session and doing the whole process.
If they want to run only two commands, they will run PsExec twice. Each time PsExec runs to execute a command a new service will be installed with the name “PsExecsvc” and a binary with the same name will be dropped in $admin share. Then after executing the command, it will delete itself.
So if we run two different commands separately via PsExec, we would find evidence of two different services being created on the endpoint. Also, opening an interactive session may alert defenders because of shell usage of CMD or Powershell.
Another important thing to discuss is that in PsExec we have the option to define our custom service name using a switch “-r”. By default, PsExec creates a service with the name “PsExecsvc” on the endpoint. This is a great detection opportunity, but it's also easily avoidable by using the switch discussed above.
Attackers can easily name their service while using PsExec whatever they want. Most of our detections will not be dependent on the service name, but it’s still worth mentioning.
In the blog examples, we will be using the PsExec service with default settings. Many adversaries in the wild still use PsExec with default options contrary to what you might think, and may not even bother changing the service name.
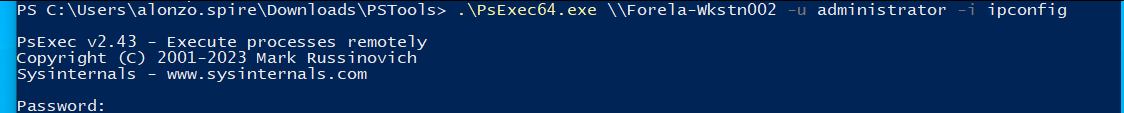
Attacking the machine
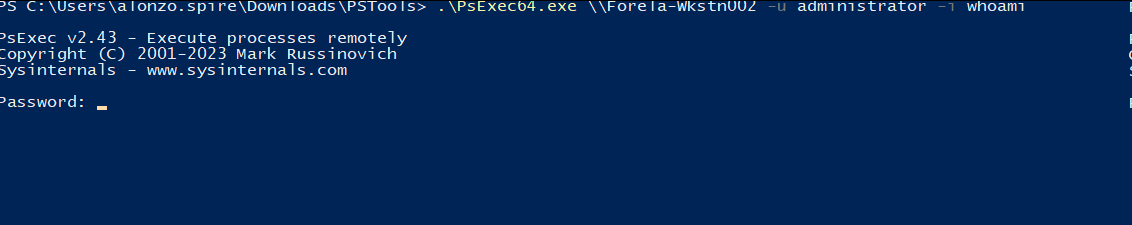
From machine one, we are providing the hostname, username, and the command we want to run on the endpoint. Now that we’ve run this command, let's run another one.
Note💡: This attack section intends only to generate some noise and artifacts on the endpoints (as this blog is defense-oriented). That’s why we won't be going into detail on advanced offensive methods and techniques using PsExec.
Artifact analysis to detect PsExec lateral movement🔍
In this section, we will discuss detection opportunities that can help security teams catch abnormal or malicious usage of the PsExec tool across their environments.
We acquired the artifacts from Forela-Wkstn002 using KAPE and will now analyze them using different tools. This starts from the most basic detection, which is the service created by PsExec at the endpoint.
So put on your blue hats, grab a fresh cup of coffee, and log on to your forensics workstation. It’s time to analyze the acquired artifacts!
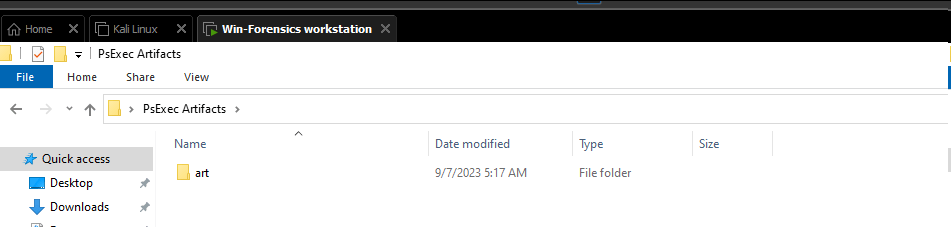
Image 3
Service creation
Whenever a service is created on a Windows system, an event is recorded in Windows-System event logs with the Event ID 7045. This event denotes that a service was successfully installed on the system. The details in this event are:
-
i) Service name: in many cases, this gives us some context or nature of the service.
-
ii) Service Filename: shows the filename and full path of the file for the service
-
iii) Service account: reveals which user context the service was installed under. If a service is installed with an admin user, privileges will be high.
Let's analyze the Systems log and filter on the relevant Event ID. We will use native event viewer for analysis.
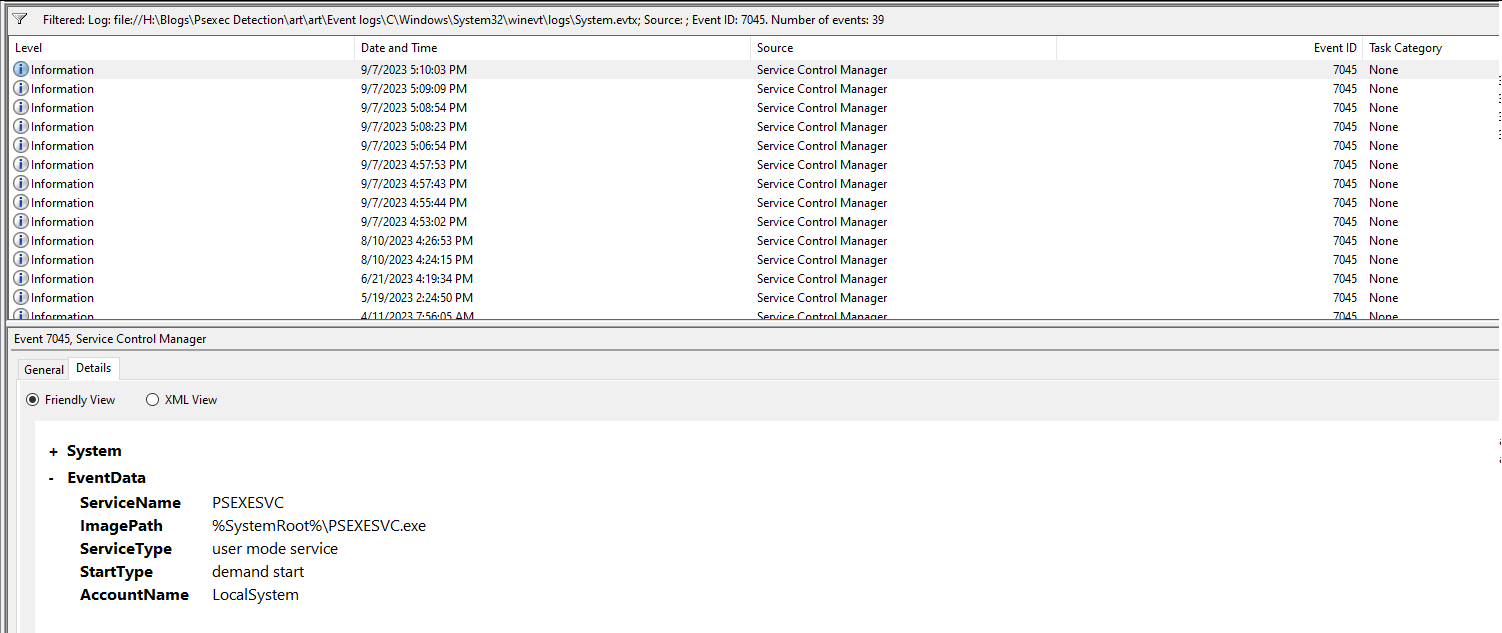
Let's analyze the latest event.
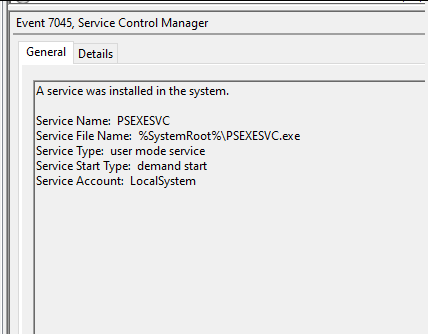
We can see the details of the event. The service name by default is PsExec and more often than not, threat actors don't change the PsExec default settings, so setting up a detection for such a common malicious name is still worth it. Although this is easily changeable when running PsExec, it’s still a powerful detection opportunity.
Next up we can see the path of the service binary: “%SystemRoot%\PSEXESVC.exe”.
Here the SystemRoot is an environment variable and its value is “C:\Windows,” where we assume that the “C” drive is the root drive where Windows is installed. So the actual path of the file becomes C:\Windows\PSEXESVC.exe.
Pro tip: The PsExec version we are discussing is the Sysinternals one. The impacket PsExec by default creates a randomized name of the service. But the service name is always an eight-character random string.
So we can set up a regex-based detection so that whenever a service with eight characters is created, it will alert. This may trigger false positives here and there, but can also catch attackers trying to evade detection.
In event viewer, the time we see is the timezone of the local computer. Thankfully Windows event logs also record the timestamps in UTC. To see the timestamp in UTC, go to the Details tab of the relevant event and expand the System dropdown menu.
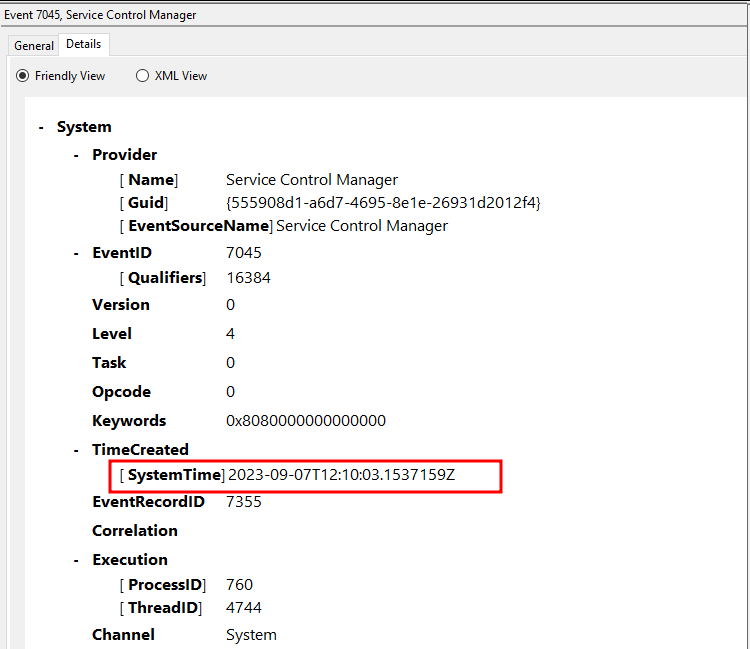
We can see the timestamp is 2023-09-0712:10:03.15.
USN Journal
In NTFS FileSystem USN (Update Sequence Number) Journal is a feature that tracks changes made to files and directories on a volume. It is essentially a log that records every modification, creation, or deletion of files and directories.
By analyzing the USN Journal, forensic investigators can gain insights into the activity and changes that have taken place on an NTFS volume.
We will be analyzing the $j file to find evidence of the PSEXESVC binary which was installed via the service. Then, we’ll investigate another relatively new artifact that further provides evidence of PsExec being executed, and also gives us context about PsExec usage—like the Hostname of the system from which PsExec was remotely executed.
This is useful because it helps in cases involving lateral movement and privilege escalation across the environment.
We will use a tool called MFTECMD by Eric Zimmerman.
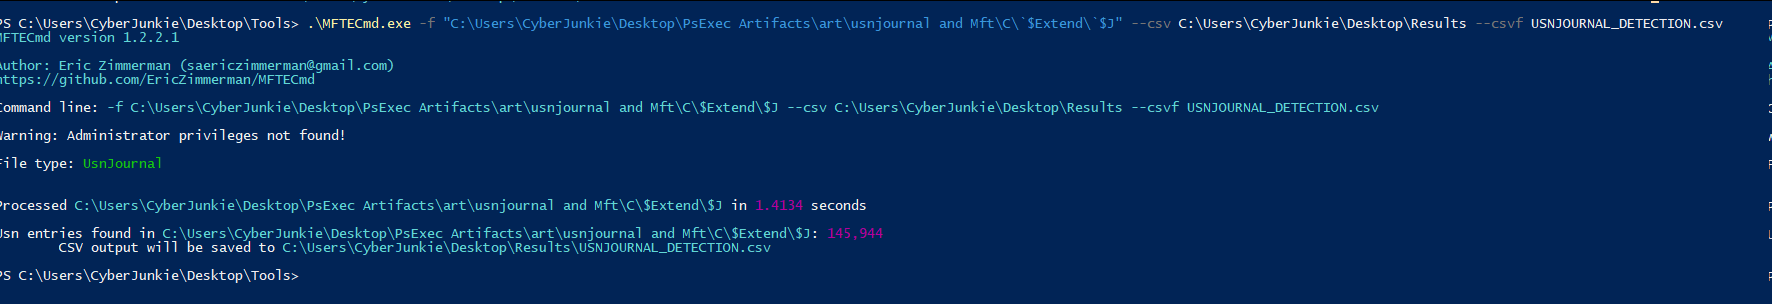
Command:
MFTECmd.exe -f "C:\Users\CyberJunkie\Desktop\PsExec Artifacts\art\usnjournal and Mft\C\`$Extend\`$J" --csv C:\Users\CyberJunkie\Desktop\Results --csvf USNJOURNAL_DETECTION.csv
Here are the arguments provided to the tool:
-f: Full path to the MFT file or $J(USN Journal) file
- - csv: Full path of the folder where you want to store the results
- - csvf: output file name
With our results ready, we will be using Timeline Explorer to read and analyze CSV files.
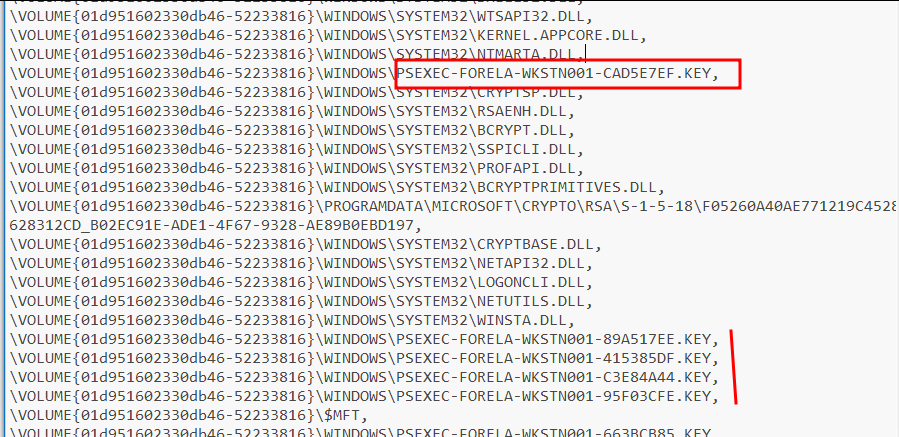
We need to look for files with extension “.key”. These files are dropped whenever PsExec is used against a system and a service binary is dropped, which in our case is named “PsExecSVC.exe.”
These files were introduced in PsExec version 2.30 and onwards. According to Microsoft the reason for these key files is:
“Previous versions of PsExec are susceptible to a named pipe squatting attack. If a low-privileged attacker creates a named pipe on a server to which a PsExec client connects, they could intercept explicit authentication credentials or sensitive command-line arguments sent by the client. The PsExec client now drops a key into file protected with an administrator-only security descriptor with a name formatted as PsExec-.key into the Windows directory on the remote system that the PsExec service uses to authenticate to the client.”
Like everything else in Windows, these key files can be valuable artifacts that help detect PsExec activity on investigations.
Let's open the CSV file we got from parsing USN Journal and filter for the extension.key
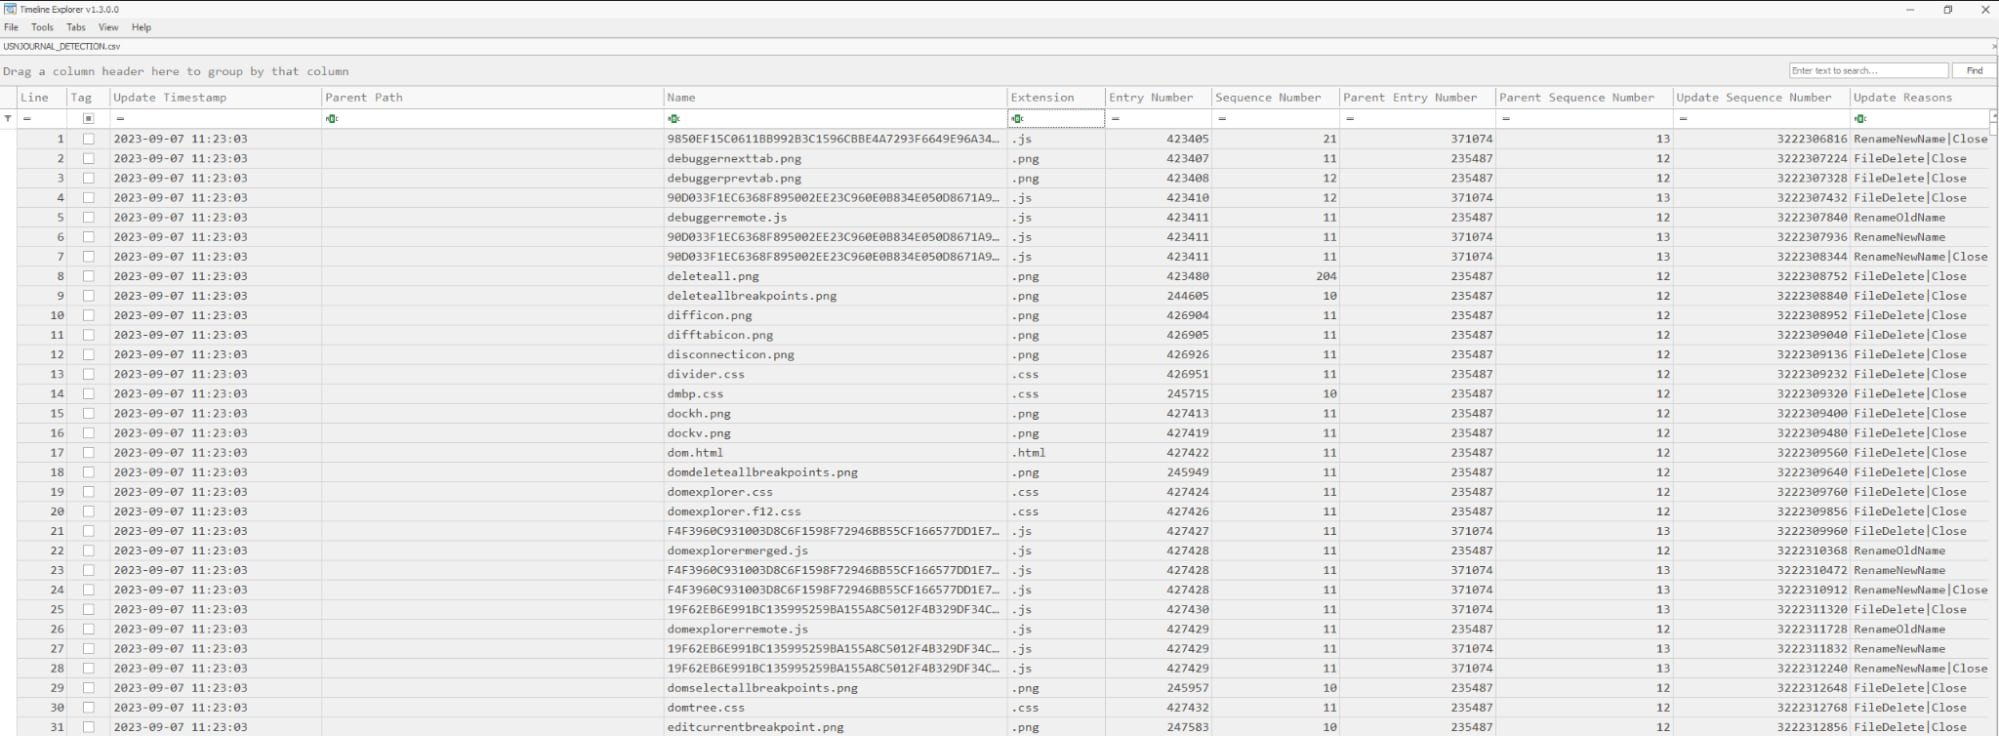
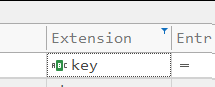
Here we can see a key file. The structure of this filename is PsExec-SOURCE_HOSTNAME-XXXXXXXX.key.

Here, the source hostname is the name of the computer from which PsExec was executed remotely, and xxx represents random hex chars. This file acts as an important piece of evidence and artifact; it tells us the hostname of the computer from which the attacker is performing lateral movement and already has some kind of foothold.
Let's explain the importance of this with a little scenario.
In our detection and forensics analysis phase, we don't know from which system PsExec was executed. As cybersecurity analysts, if we find evidence of these key files and the source hostname, we can then add that system to our forensics analysis scope.
The machine may already be compromised and the attacker may have remained undetected. But after their lateral movement, we can find evidence of that system and can perform incident response on that system too.
USN Journal records file activities, like when the file was created and various other activities. Now we know the name of this key file, let's search for it.
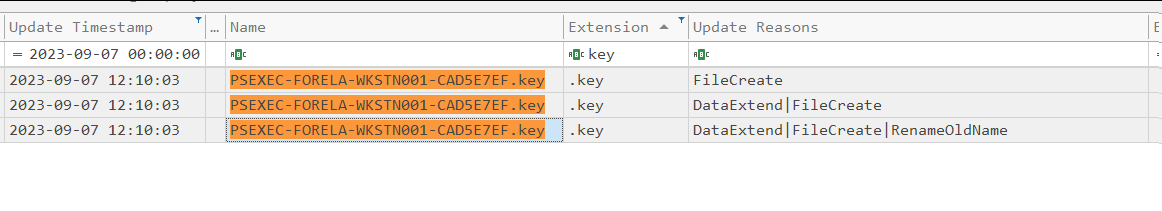
We can see different activities:
-
DataExtend shows when the file was created on the disk
-
RenameOldName reveals what that file was named for the first time
-
Filecreate shows when the file was fully on the disk
We can see the timestamps too. Here the file was small, and all actions were done in a matter of milliseconds.
Let's move on to another artifact that will build more evidence of PsExec's presence and also unveil information about the key file we just discussed.
Prefetch
Prefetch files are important evidence of execution in Windows systems. A prefetch file with the extension “.pf” is created for any exe file that is executed on the system. They are part of the Windows optimization feature which speeds up the loading of applications files.
Prefetch files are located at “C:\Windows\Prefetch”. They are not user-specific but have a global scope, so user attribution cannot be done using this artifact.
The prefetch file’s existence confirms that a certain exe was executed on the system at some point. It stores the original executable path, full name, and loaded resources (any files accessed or interacted with by the exe in question).
Another great reason prefetch is awesome is that it stores (and shows) the eight last execution timestamps. This supports user behavior analysis—provided that we’ve attributed a username/user account with the execution.
We will use a tool called PEcmd by Eric Zimmerman, to parse prefetch files.

Command: PECmd.exe -d "C:\Users\CyberJunkie\Desktop\PsExec Artifacts\art\Prefetch\C\Windows\prefetch" --csv C:\Users\CyberJunkie\Desktop\Results --csvf Prefetch_analysis.csv
Let's break down the command arguments:
-d: Provides the directory or path where prefetch files to be analyzed are stored. This command recursively searches all child directories.
- -csv: Provides the directory where we want to store the results.
- -csvf: Provides the results of the CSV filename.
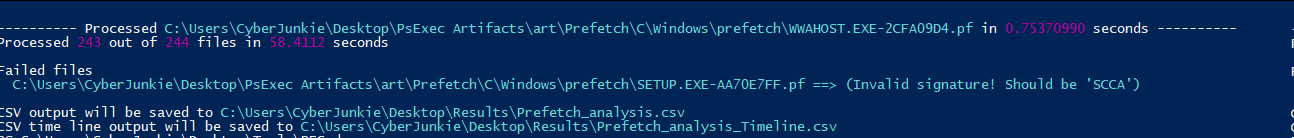
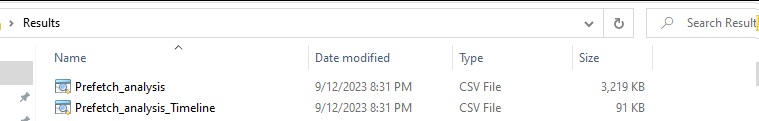
We have two CSV files. We are most interested in the first one, “prefetch_analysis,” because it holds actual analysis data—the second one is just a timeline summary.
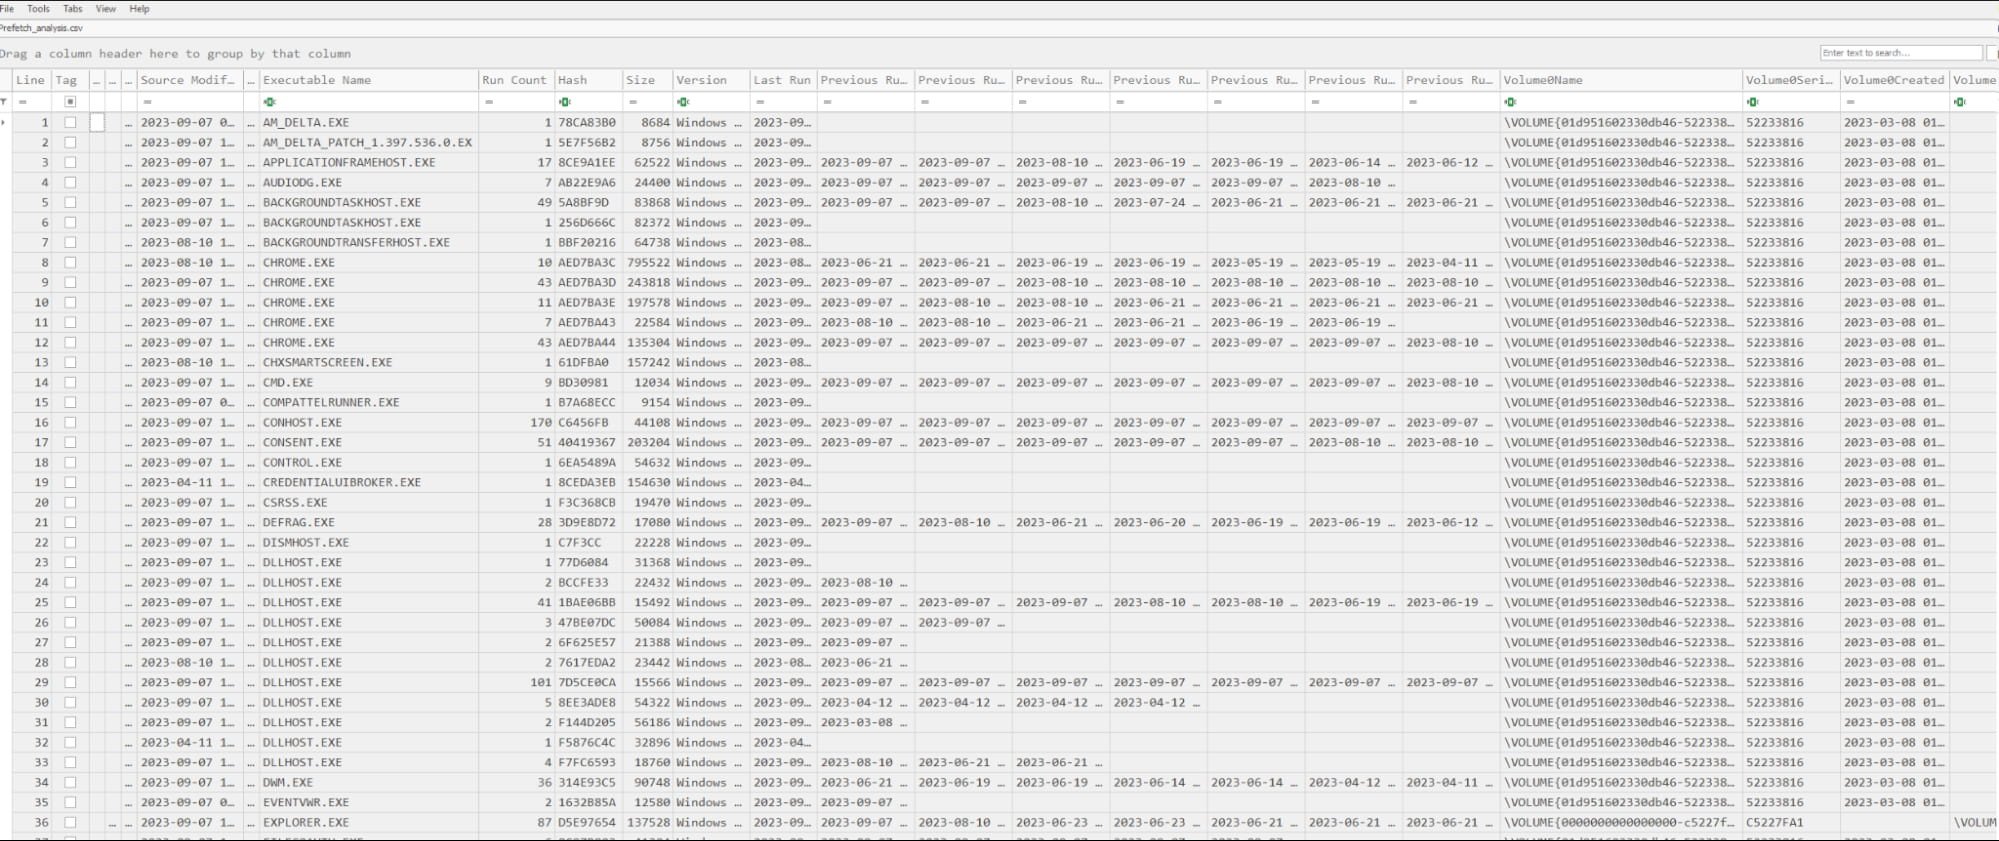
So what we’re focused on is the execution of the service binary, which as we know from our previous analysis phase, is named “PSEXESVC.EXE.” When we filter the exe name basis for the name, it gives us exciting results to investigate!
The run count shows PsExecsvc.exe was run 9 times. This is true because to showcase this artifact I ran PsExec multiple times.
We already discussed that whenever PsExec is run against a system, it creates a service, drops its service binary, and then deletes the service and that dropped executable after its work is done. But prefetch files never get deleted. Even if the original exe was deleted from the system.
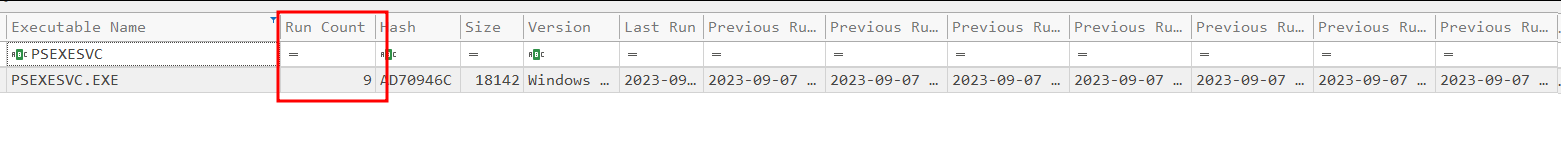
So even though psexesvc.exe was created and deleted nine times, the prefetch file remained and maintained the count. And what's even more interesting is that we have got eight last timestamps whenever PsExec was run.
Now if see the column “Last Run”, it shows the same timestamp as we’ve discussed.
We have the PsExec instance which was executed the latest (12:10:03). If we see such behavior in a real incident where let's say PsExec run count was found to be nine from the prefetch file, we’ll have evidence that the attacker ran PsExec against the system nine times or maybe ran nine remote commands in total.
We also will have timestamps for the last eight executions, which will help develop a forensics timeline.
Now let's discuss another important piece of evidence from the prefetch. Remember we discussed the PsExec key files in the USN Journal artifact?
While that artifact is ideal for the detection opportunity, there’s a catch: USN Journal is a very busy file and gets rolled over very quickly.
Since it records every File operation occurring on the disk, it overwrites the old data to write new ones, or else the file would probably go in terabytes of size very quickly which is not practical. A security event is rarely detected immediately, the latest Splunk state of security report highlights that 74% of US organizations take 2 weeks or longer to detect incidents on average…till then our beloved USN Journal gets overwritten.
Prefetch to the rescue! We can use prefetch alongside the USN Journal for this type of analysis. We discussed that prefetch also records the files loaded or interacted by the exe, which luckily for us includes key files.
Let's open this to see all the loaded files by PsExec.
Here we see different files, including our key files. We can see references of other key files too, which were dropped when we ran PsExec many times as already mentioned.
Prefetch can be used to find the PsExec key files in cases where USN Journal doesn’t hold the relevant evidence we can refer back to our PreFetch artifacts. (Having previously explained PreFetch files in some depth, scroll up if you’ve forgotten!)
Once you scratch beneath the surface, PreFetch files can provide analysts and forensic investigators a whole lot of value.
Shimcache/AppCompatCache
This will be the last disk-based artifact we're gonna discuss in this blog.
ShimCache or AppCompatCache is a Windows feature that is used for maintaining compatibility between older applications and modern Windows.
For example, we can run a tool intended for Windows XP on Windows 10. ShimCache is part of SYSTEM registry hive and is located at “HKLM\SYSTEM\CurrentControlSet\Control\SessionManager\AppCompatCache\AppCompatCache.”
Before diving into the forensic value of this artifact, it's important to understand its behavior. Shimcache entry is written for an executable file when:
-
The exe is executed either from the local drive, removable media, or even from network shares. It also stores UNC paths, which is valuable information during incident response.
-
The exe is visible in the Windows Explorer window (GUI). So if we open a folder containing a few exe files in Windows Explorer like a normal user, those exe files would get shimmed and would be entered into Shimcache.
Even though those exe files were never executed but still got recorded in Shimcache. This may help with analyzing user behavior as we can prove that a certain folder was accessed at some point in time.
As already discussed above, Shimcache isn't necessarily evidence of execution. So we need support for some other artifacts like MFT, prefetch, or LNK files. In our case, we already analyzed prefetch files, so we can correlate the analysis of that with Shimcache to further confirm the evidence.
Shimcache provides the file name and full path from where it was executed or Shimmed. It also stores the last modification timestamp for the executable, which should always be correlated from other artifacts like $FILE_NAME timestamp from MFT.
This is because the Shimcache timestamp is the same as the $STANDARD_INFORMATION attribute from MFT which can easily be manipulated by attackers using anti-forensics techniques like timestomping.
Shimcache stores 1024 entries at a given time. When there are over 1024 entries the oldest one starts getting overwritten. But this is not as unfortunate for us as USN Journal because Shimcache by nature holds information for a longer time—weeks or months—unless you execute or view 1024 exe files just for fun 🤓.
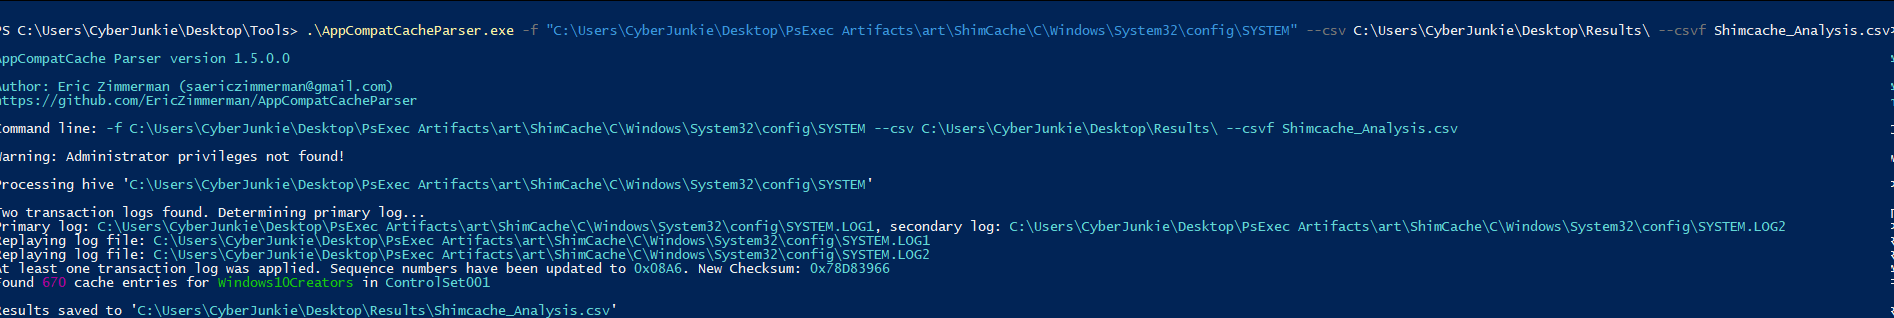
We will be using a tool called AmCompatCacheParser by Eric Zimmerman.

Command: AppCompatCacheParser.exe -f "C:\Users\CyberJunkie\Desktop\PsExec Artifacts\art\ShimCache\C\Windows\System32\config\SYSTEM" --csv C:\Users\CyberJunkie\Desktop\Results\ --csvf Shimcache_Analysis.csv
Let's discuss the arguments in this command:
-f: This switch is to specify the full path to SYSTEM registry hive from the compromised system
- - csv: To provide path of the output directory where we want to store the results
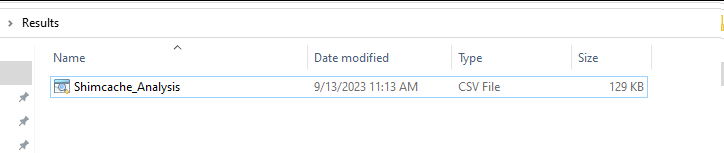
- - csvf: To provide output filename
Now, let's analyze the CSV file.
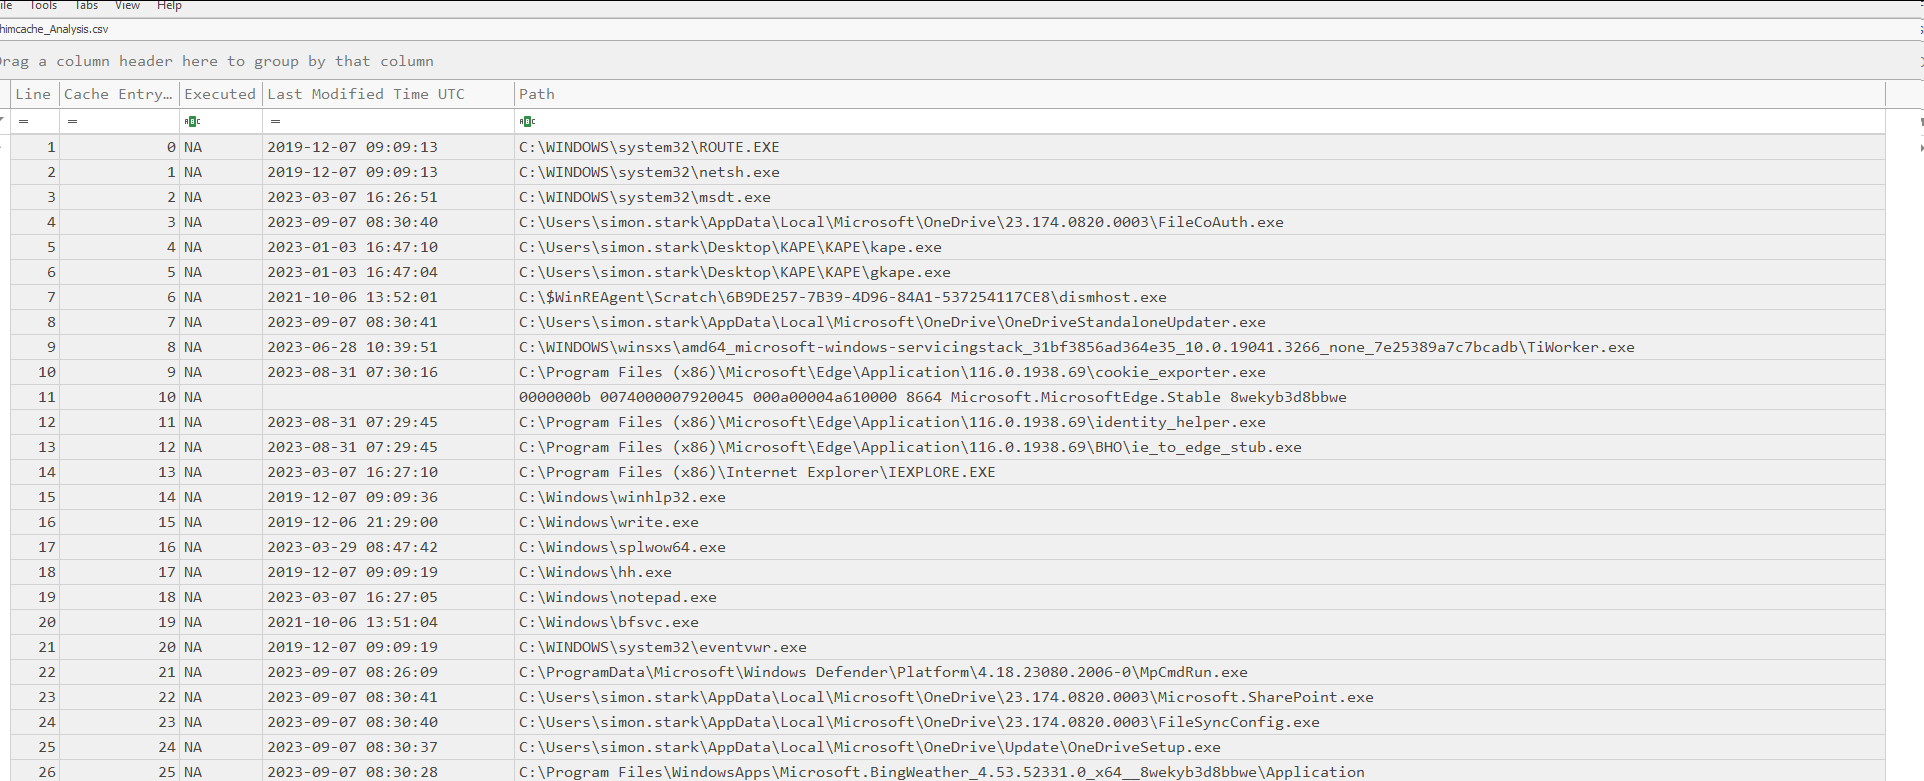
The entries are in order in Shimcache, with the oldest one on the top. Since we already know the Service Binary name that PsExec dropped on the system, let's filter by that. If we don’t know the service binary name, we can filter on by paths like C:\Windows\*.exe.

Here, we can see the service binary and the timestamp associated with it, are the same as we have concluded so far. In the prefetch section, we found out that PsExec was run nine times in total. Since Shimcache stores one timestamp entry, the timestamp found in Shimcache will always be the most recent execution timestamp.
Now we have verified our findings from multiple artifacts. So we can confirm that the PsExec was run against the system a total of nine times. The most recent execution of the PsExec instance was 2023-09-07 12:10:03.
Named pipes
Named pipes facilitate inter-process communication in Windows. The named pipe technique uses a file to exchange messages between the two processes.
For example, if one process wants to communicate with another, it can send a message over the network or by using a file, where one process writes the message to that file and the other one reads it. This makes it a valuable target to be abused by malicious actors and tools
PsExec also uses named pipes whenever run against a system. The good thing for us is that we can use this as a detection opportunity!
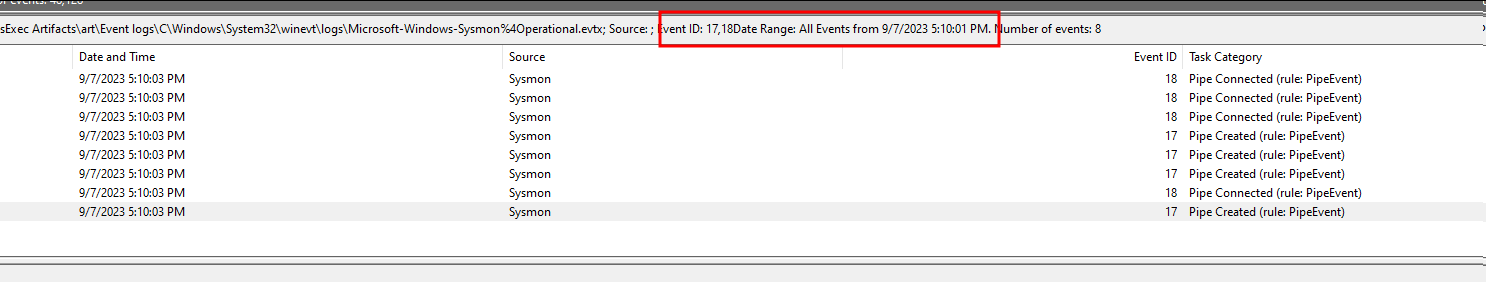
To audit named pipes, we can configure the native event logs, but we will be using sysmon for this example as it is more verbose. Sysmon event ID 17 denotes named pipe creation and ID 18 denotes named pipe connected.
Let's filter the sysmon logs from the compromised system and also filter by time so that we analyze named pipe events of the latest and last PsExec instance.
As we can see, the first event related to named pipe is that a named pipe is created with the same name as the name of the Service created by PsExec.
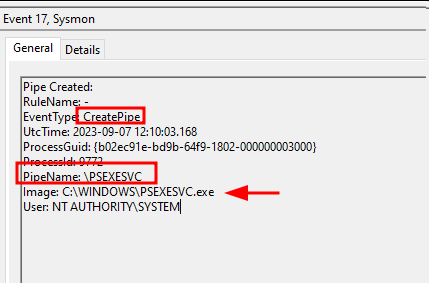
We can also see the service binary that created these named pipes. Using these named pipes, the remote commands and results are sent and received between victim and attacker.
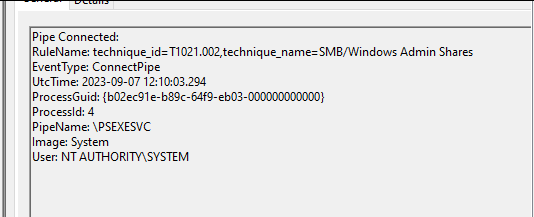
Immediately after this event, we see event 18 which tells us that this named pipe successfully connected.
Now this information is not new because we already knew the service name and service binary name. However, what's interesting about named pipe detection is that it provides some new keyword-based detection.
PsExec also creates and connects named pipes of three different names which end in these following keywords
-
*-stdin
-
*-stderr
-
*-stdout
We can create our detection based on these keywords alone. But that's not all. The naming convention is also essential for these named pipes. The general structure of these named pipes are: \PsExecServiceName-AttackerHostname-randomNumber-stdin/stderr/stdout
Let's talk with a practical example from our scenario:
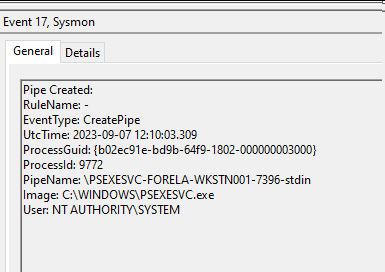
We can see the ServiceName and the attacker hostname from where the attack came, then a random number and stdin keyword in the end.
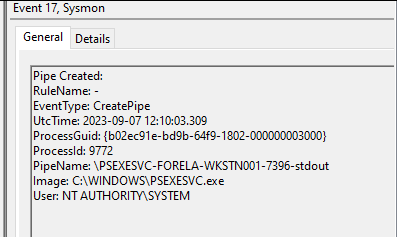
The next event is with the same name but a different keyword at the end.
Again, the last keyword is changed.
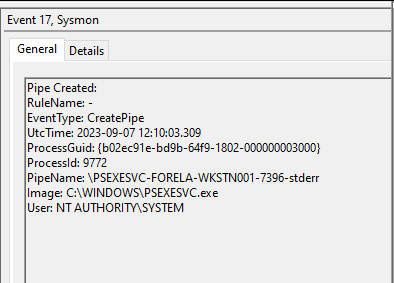
So, in our case, a total of 4 named pipes were used by PsExec in a single instance:
-
\PSEXESVC
-
\PSEXESVC-FORELA-WKSTN001-7396-stdin
-
\PSEXESVC-FORELA-WKSTN001-7396-stdout
-
\PSEXESVC-FORELA-WKSTN001-7396-stderr
This telemetry provides us with important information similar to our key file-based detection. It also provides a solid detection opportunity based on the keywords it uses.
This concludes the blog, but we have a bonus mini section for you awesome HTBers!
Bonus section
If you have sysmon running on all your endpoints and logs are ingested into the SIEM, then you are in luck. Sysmon provides perfect visibility on the endpoints whether it be from process execution stance, network, filesystem, or registry manipulation.
Let's lay down some Sysmon event IDs that may help in uncovering PsExec malicious usage across your environment:
-
Event ID 1: This event ID records all the processes executed on the endpoint. For detecting PsExec we should look out for the exe file name “PSEXESVC.exe” or any random eight-character named binary. The full path of the file would be C:\Windows\Binary.exe
-
Event ID 3: The PsExec binary identified from the previous event ID making a network connection is also a detection opportunity. This information is recorded in Event ID 3 in sysmon; it stores the source and destination IP addresses and the process name making the connection
-
Event ID 11: This event ID denotes a file creation event. We could monitor for the creation of the PsExec service binary file or the PsExec key files.
-
Event ID 12: This event is generated whenever a registry object is added or deleted. We can use this to monitor the HKLM\System\CurrentControlSet\Service\XXXX registry key, where xxxx denotes any service name. We would be specifically interested in the PSEXESVC name or any random eight-character named service.
-
Event ID 17: This event is generated for named pipe communications. We already discussed this in a separate section.
Level up your investigative skills
If you’re looking for guided training on becoming an analyst or incident responder, check out our new job role path for defensive security professionals!
Looking for hands-on environments to hone your skills? HTB Labs has you covered with virtual lab environments to sharpen your offensive or defensive cybersecurity skills. You can also practice specific techniques with forensic and reversing challenges on the platform (with more to come soon!).
|
Author bio: Abdullah Yasin (CyberJunkie), Defensive Content Engineer, Hack The Box Abdullah Yasin (aka CyberJunkie) is an enthusiastic DFIR Practitioner specializing in memory forensics with two years of industry experience as a Security Engineer, holding BTL1 and eJPT certifications. He has created multiple CTFs for local hackathons in his country. Abdullah has a burning passion for progression and learning through gamification, and has developed multiple DFIR-related courses, labs, and investigative content for the LetsDefend platform. You can connect with him on LinkedIn. |